Line Tools
This button on the chart is used for drawing different lines. This function includes the following:
Draw Trend Line
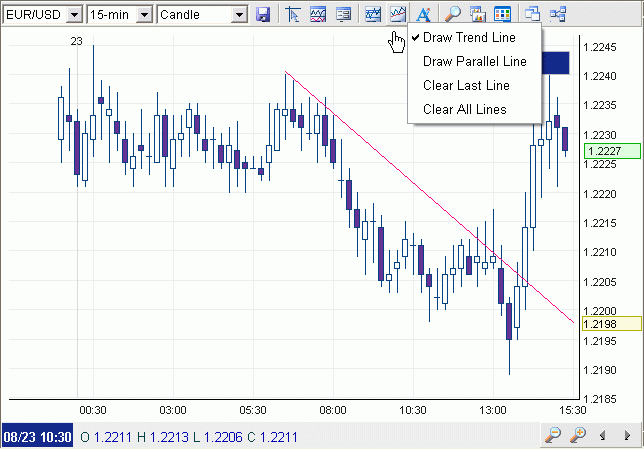
The Draw Trend Line function is used to draw a line on the chart anywhere the user chooses. This function is useful for drawing custom trend lines and support and resistance levels to facilitate the analysis.
To use the function, first find a starting point. Click on the chart once. A black line will appear and will follow wherever the mouse cursor moves to. Then drag the mouse to the end point. Once the end point is confirmed, click on the chart again and the line will be drawn in red. The line will be extended to the price axis.

Draw Parallel Line
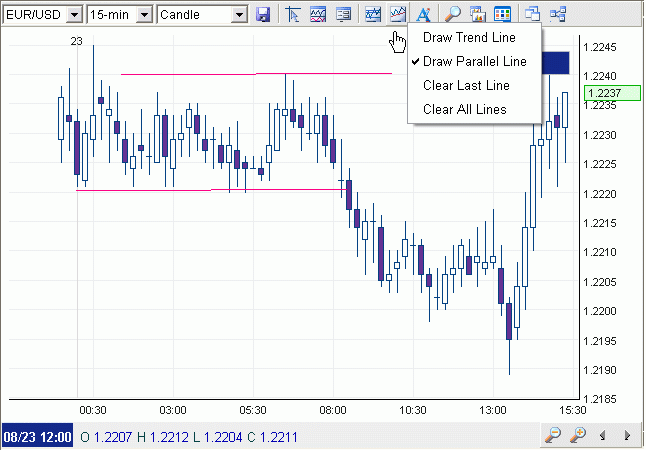
The Parallel Line function is similar to the Draw Trend Line function. This function is useful for drawing price channels and support and resistance levels to facilitate the analysis.
To use the function, press 'Draw Parallel Line' button and draw a line first. At this point, another line, parallel to the one drawn, and of equal length, will appear. Drag the line to a desired position on the chart. Then click on the chart once more for the line to be set. Parallel lines can be drawn as many as one chooses.

Clear Last Line
To erase the previous drawn line/parallel line, press 'Draw Line' > 'Clear Last Line' on the toolbar of the chart panel.
Clear All Lines
To erase all lines on the chart, press 'Draw Line' > 'Clear All Lines' on the toolbar of the chart Panel.

